 StackScopes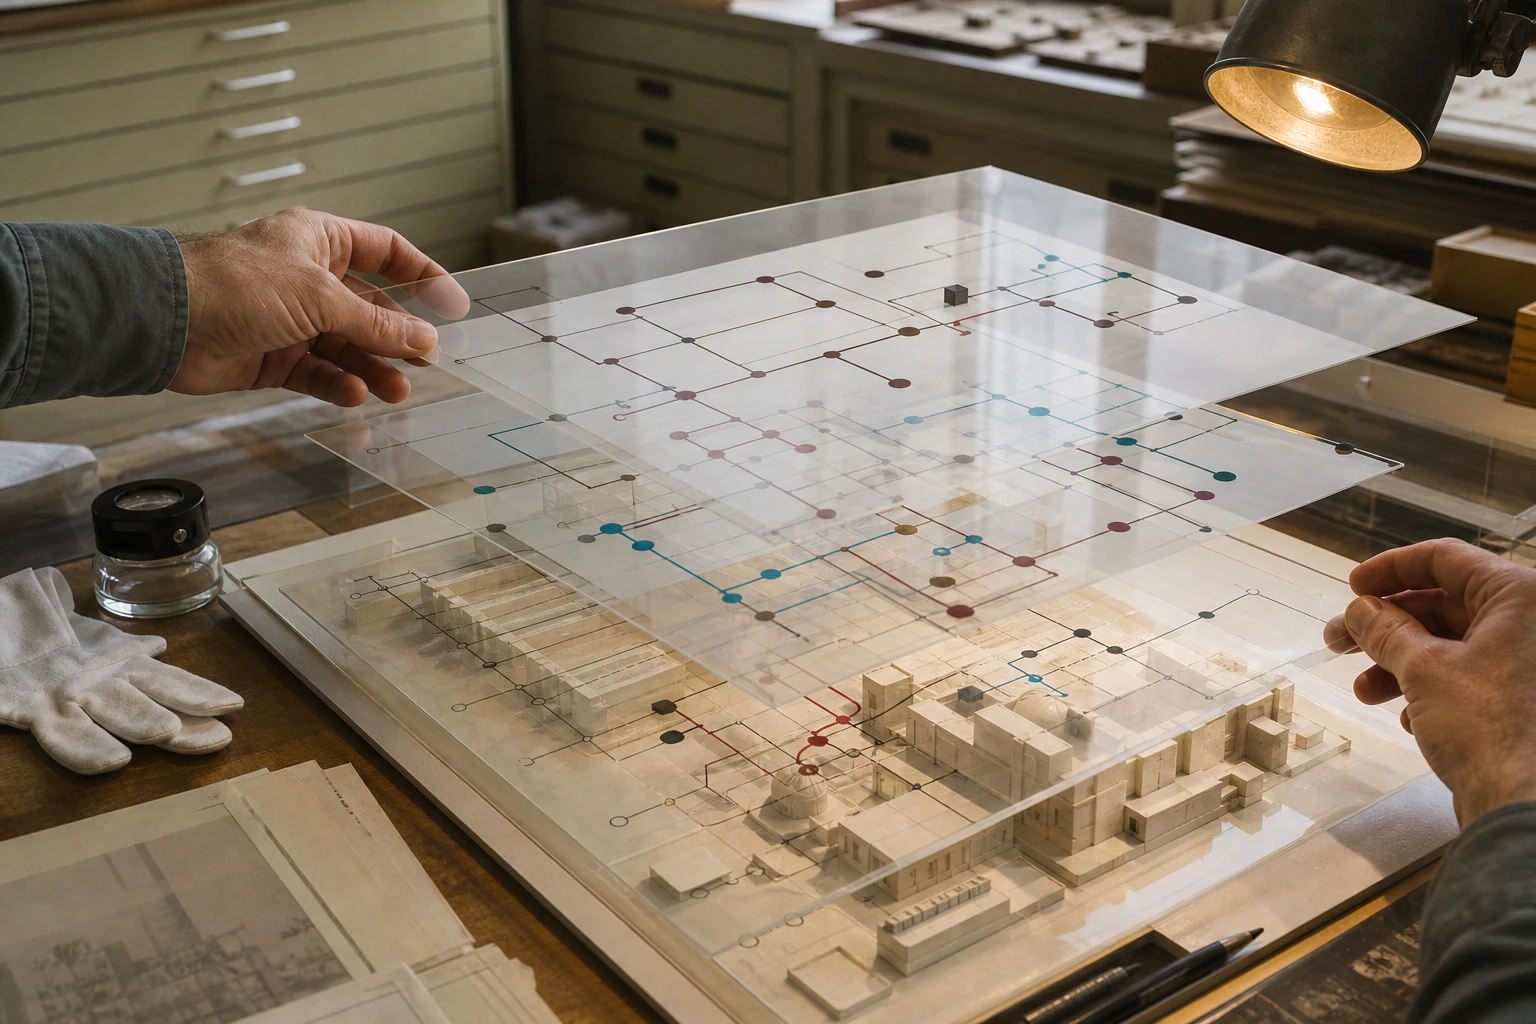
A current cloud topology can explain how resources appear to be connected now. It cannot reliably explain how they were connected before an incident, which dependency a deployment introduced, whether a deleted resource was part of a critical path, or how architecture drift accumulated over several weeks.
Cloud infrastructure is temporal by nature. Resources are created and replaced, policies change, routes move, targets register and deregister, tasks scale, certificates rotate, stacks deploy, and ownership evolves. A graph that overwrites yesterday with today loses exactly the context engineers need when production behavior becomes surprising.
A temporal infrastructure graph preserves resource state and dependency relationships across time. It connects observations and events without pretending they are the same thing. It supports point-in-time topology, before-and-after comparison, change replay, incident reconstruction, historical dependency analysis, drift prioritization, and model-based simulation against past or proposed states.
This article explains why time is a first-class data dimension rather than an optional audit log. It covers snapshot limitations, state and events, topology evolution, deleted-resource visibility, incident windows, retention, query complexity, simulation, and the operational trade-offs of maintaining history.
Table of contents
- The snapshot trap
- State and event are different
- What a temporal infrastructure graph represents
- Model time explicitly
- Track topology evolution
- Preserve deleted resources
- Reconstruct an incident window
- Compare before and after
- Replay change without inventing precision
- Analyze historical dependencies
- Detect and prioritize drift
- Simulate against historical state
- Retention and storage
- Query complexity and design choices
- A hypothetical incident reconstruction
- Limits and trade-offs
- Key takeaways
- Frequently asked questions
The snapshot trap
Most cloud discovery begins with a snapshot. Collectors query service APIs and record the resources and configurations they can see. The result answers useful questions:
- Which resources exist?
- Which accounts and Regions are in scope?
- What is the current configuration?
- Which dependencies can be derived now?
- Which resources lack tags or expected controls?
The trap appears when the current snapshot is treated as the complete operational truth.
Suppose a production incident begins at 14:10. An engineer rolls back at 14:23. Automatic scaling replaces unhealthy tasks at 14:25. The discovery system refreshes at 14:30. Its graph shows the rolled-back configuration and new task identities. The topology looks healthy. The edge that caused the incident is gone.
An event log may show an API call, but the investigator still needs context:
- What was the previous value?
- Which resources used it?
- Did the relationship become active immediately?
- Which other changes were part of the deployment?
- Did the resource exist before replacement?
- Was the event successful?
- What did discovery actually observe?
A snapshot also makes architectural trend analysis difficult. A shared security group can accumulate dependents gradually. No single change looks alarming, but the blast radius grows. If each sync overwrites the graph, that expansion is invisible.
The solution is not to retain occasional screenshots of the entire environment. It is to model state and relationship validity across time.
State and event are different
State describes what is true, or was observed to be true, for a resource or relationship. An event describes something that happened.
Examples of state:
- A listener forwards to target group A.
- A role trust policy includes principal B.
- A database uses security group C.
- A task definition references secret D.
- A route table sends a prefix through gateway E.
Examples of events:
- A user called
ModifyDBInstance. - A pipeline updated a CloudFormation stack.
- Automation registered a target.
- An engineer changed a route.
- A role assumption occurred.
Events help explain transitions, but they do not always provide a complete state image. An event can be delayed, absent for a source outside collection, or difficult to interpret without previous configuration. Some API calls include request parameters but not the final normalized state. Managed services may perform changes that appear through different channels.
Snapshots provide observed state, but they may miss the exact transition time. If a collector observes configuration A at 14:00 and B at 14:15, the change happened within that interval unless an authoritative event narrows it.
A temporal graph should preserve both:
- Observed state: What collectors saw and when.
- Event context: What action was recorded and when it occurred.
Connecting them provides stronger evidence. Do not silently turn an observation interval into a precise event timestamp.
What a temporal infrastructure graph represents
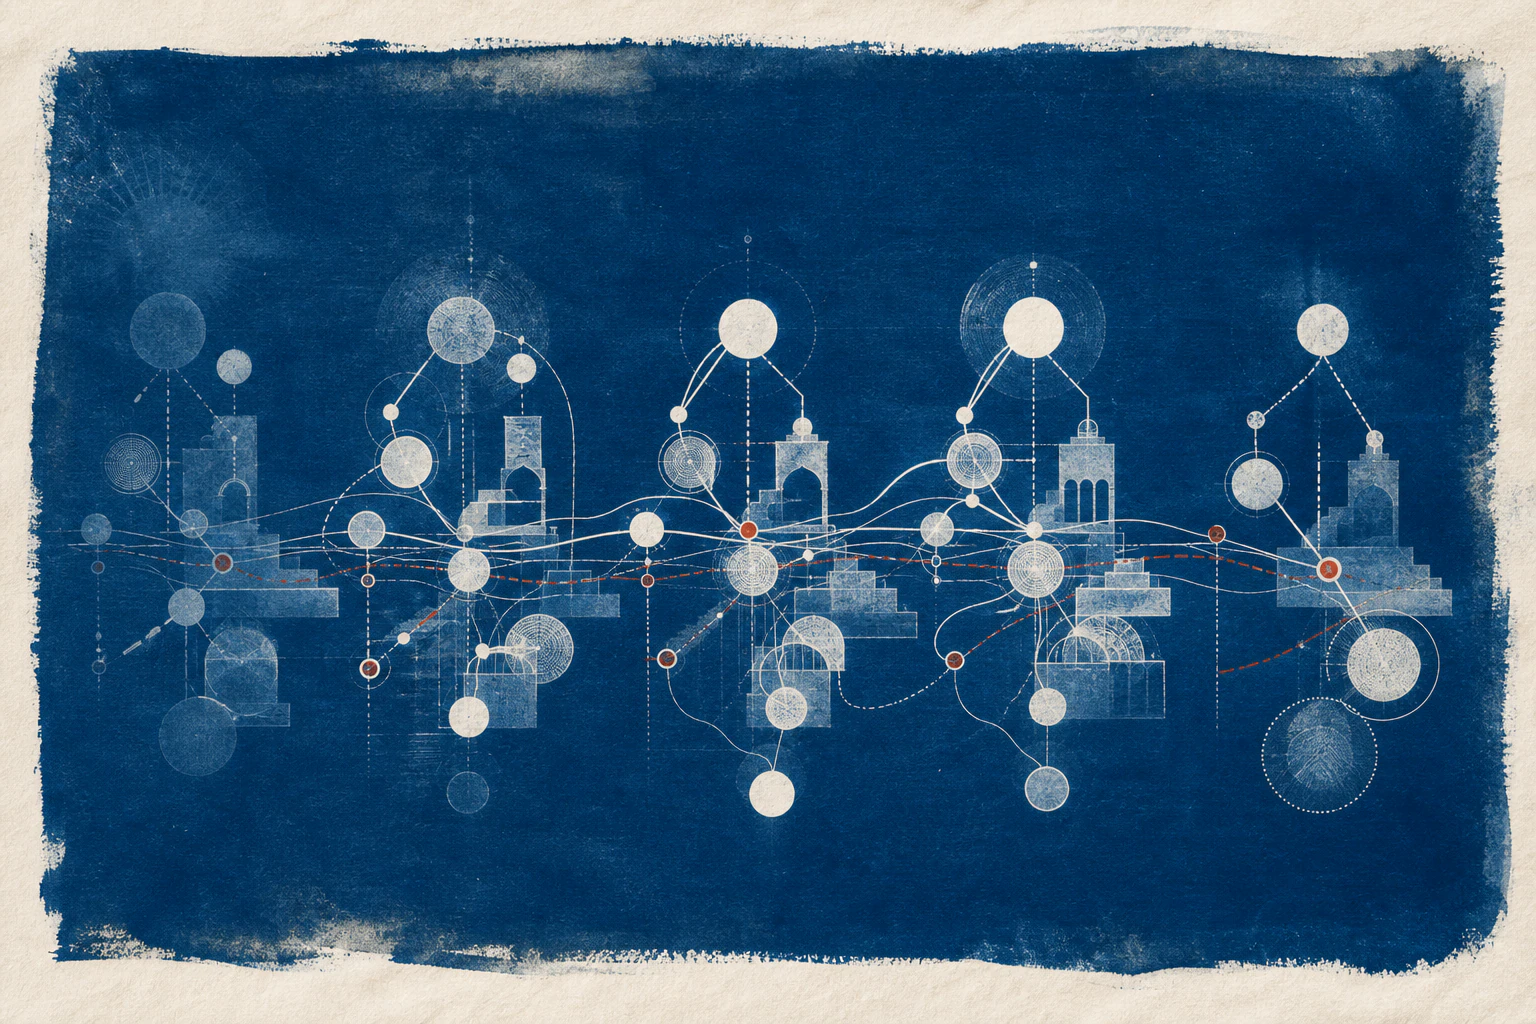
A temporal graph adds time to nodes, edges, attributes, and evidence.
Temporal nodes
A resource identity can persist while its properties change. The node represents the resource; versioned state records represent configuration over time. Replacement creates a new provider resource identity, even if it serves the same application role.
Temporal edges
Relationships have validity. A listener forwarded to target group A until a deployment changed it to B. Both edges matter historically, but only one should be active at a selected time.
Temporal attributes
Security groups, policies, routes, tags, scaling settings, and ownership can change independently. Field-level history makes comparisons precise without duplicating an entire node for every small change.
Temporal evidence
Runtime traffic, traces, and user validation exist within observation windows. An edge observed last quarter is not the same as an edge observed now. Evidence needs timestamps and freshness semantics.
Events
API, deployment, incident, and alert events can attach to nodes and relationships. They explain or contextualize state transitions.
Higher-level continuity
Workloads and capabilities can persist while underlying resources are replaced. The graph may represent:
- Physical or provider resource identity
- Logical infrastructure identity, such as a Terraform address
- Workload identity, such as checkout API
- Customer capability identity
These layers prevent replacement from erasing operational continuity or merging distinct resources incorrectly.
Model time explicitly
Temporal modeling starts by choosing time semantics.
Observation time
Observation time records when the system collected or received a fact. It is always available to a well-designed collector.
Effective or event time
Effective time describes when the change occurred in the source system. CloudTrail or a deployment system may provide it. It can differ from collection time.
Validity interval
A version can be valid from one time until another. When a new state appears, the previous interval closes. For an inferred relationship, validity may mean “supported by evidence during this window,” not absolute truth.
Transaction time
Transaction time records when the temporal store accepted the record. It helps audit late arrivals and corrections.
Not every implementation needs full bitemporal database terminology exposed to users. It still needs to avoid conflating these concepts.
Consider:
- State A observed at 10:00
- API event at 10:04
- State B observed at 10:10
- Event ingested at 10:12
The system can infer that state transitioned during the interval and associate the event as likely context. It should not claim state B was verified at exactly 10:04 unless the source guarantees that conclusion.
Clock skew, ingestion delay, retries, and eventual consistency also affect ordering. Store source timestamps and ingestion timestamps, and expose uncertainty where event sequences matter.
Track topology evolution
Topology changes when nodes, edges, or dependency behavior changes.
Examples include:
- A resource is created or deleted.
- A listener begins forwarding to a new target group.
- A service starts using a new queue.
- An IAM policy permits a new path.
- A route redirects traffic.
- A secret reference changes.
- A workload moves to another account.
- A resource becomes shared by an additional team.
- A fallback path is removed.
A useful temporal graph can answer:
- When did this edge first appear?
- When was it last observed?
- Which deployment introduced it?
- How many workloads depended on this resource last month?
- When did a critical path become single-homed?
- Which relationships changed during the incident window?
Topology evolution should be scoped. Autoscaling can create many short-lived compute instances and overwhelm a human view. The model can retain physical identities while aggregating them under a stable service or autoscaling group for analysis. Aggregation rules must remain inspectable so important zonal placement is not hidden.
Changes should be classified by operational meaning. A tag correction differs from a route replacement. A new optional analytics consumer differs from a required authentication dependency. The graph can associate field-level changes with affected edges and workload context.
Preserve deleted resources
Deletion is an event and a state transition, not a reason to erase history.
Deleted resources matter because:
- They may have contributed to an incident.
- Their removal may have broken dependencies.
- A rollback may recreate them with new identity.
- Security investigators may need past access paths.
- Cost and drift analysis may need lifecycle history.
- Recovery planning may refer to retired components.
A deleted node should be excluded from current topology by default but available in point-in-time views. Its last known configuration, relationships, owner, evidence, and deletion context should remain subject to retention policy.
Do not infer deletion merely because one collection attempt failed. Permissions, throttling, regional errors, and temporary API problems can make resources disappear from a scan. Require a trustworthy signal or repeated reconciliation according to resource behavior. Record collection coverage separately.
Replacement requires additional care. Infrastructure-as-code may destroy one resource and create another under the same logical address. The graph should show:
- Old provider resource identity
- End of its validity
- Replacement event
- New provider identity
- Shared logical workload context
This preserves both physical truth and operational continuity.
Reconstruct an incident window
Incident reconstruction asks what the system looked like and how it changed around a defined period.
Start with:
- Incident start, detection, and recovery times
- Affected capability
- Alerting resources
- Deployment or change windows
- Relevant accounts and Regions
Then assemble:
- Point-in-time topology before the incident.
- Node and edge changes during the window.
- API and deployment events.
- Runtime observations and alerts.
- Topology after recovery.
- Coverage gaps and late-arriving evidence.
The graph supports two navigation directions:
- From the affected capability toward dependencies, to explore possible causes.
- From a change or failing resource toward dependents, to estimate impact.
Time ordering helps distinguish correlation from causation but does not prove it. A security-group change five minutes before errors is relevant evidence. It may still be unrelated. The investigation should show the path, field change, actor or automation context, and runtime evidence.
Temporal comparison also reduces hindsight bias. Current topology may include a mitigation that did not exist at incident start. Recovery actions can make a system look more resilient than it was during the failure.
Compare before and after
Before-and-after comparison turns raw version history into operational insight.
A useful diff should identify:
- Created and deleted resources
- Changed attributes
- Added and removed edges
- Changed edge properties
- Ownership changes
- Criticality changes
- New shared dependencies
- Removed fallback
- Customer-capability mapping changes
The comparison must use meaningful identity. If an autoscaling group replaces three instances, a naive diff may show six major changes. At the service layer, the meaningful topology can be unchanged. Conversely, replacement of a stateful database should not be hidden as routine instance churn.
Field-level diffs should connect to topology consequences. A changed security-group rule matters because it enables or blocks specific dependency paths. A route change matters because affected subnets use it. An IAM change matters because it creates or removes access paths.
This is the difference between configuration drift and topology drift. A text diff says a value changed. A temporal graph explains which relationships and capabilities the change may influence.
Replay change without inventing precision
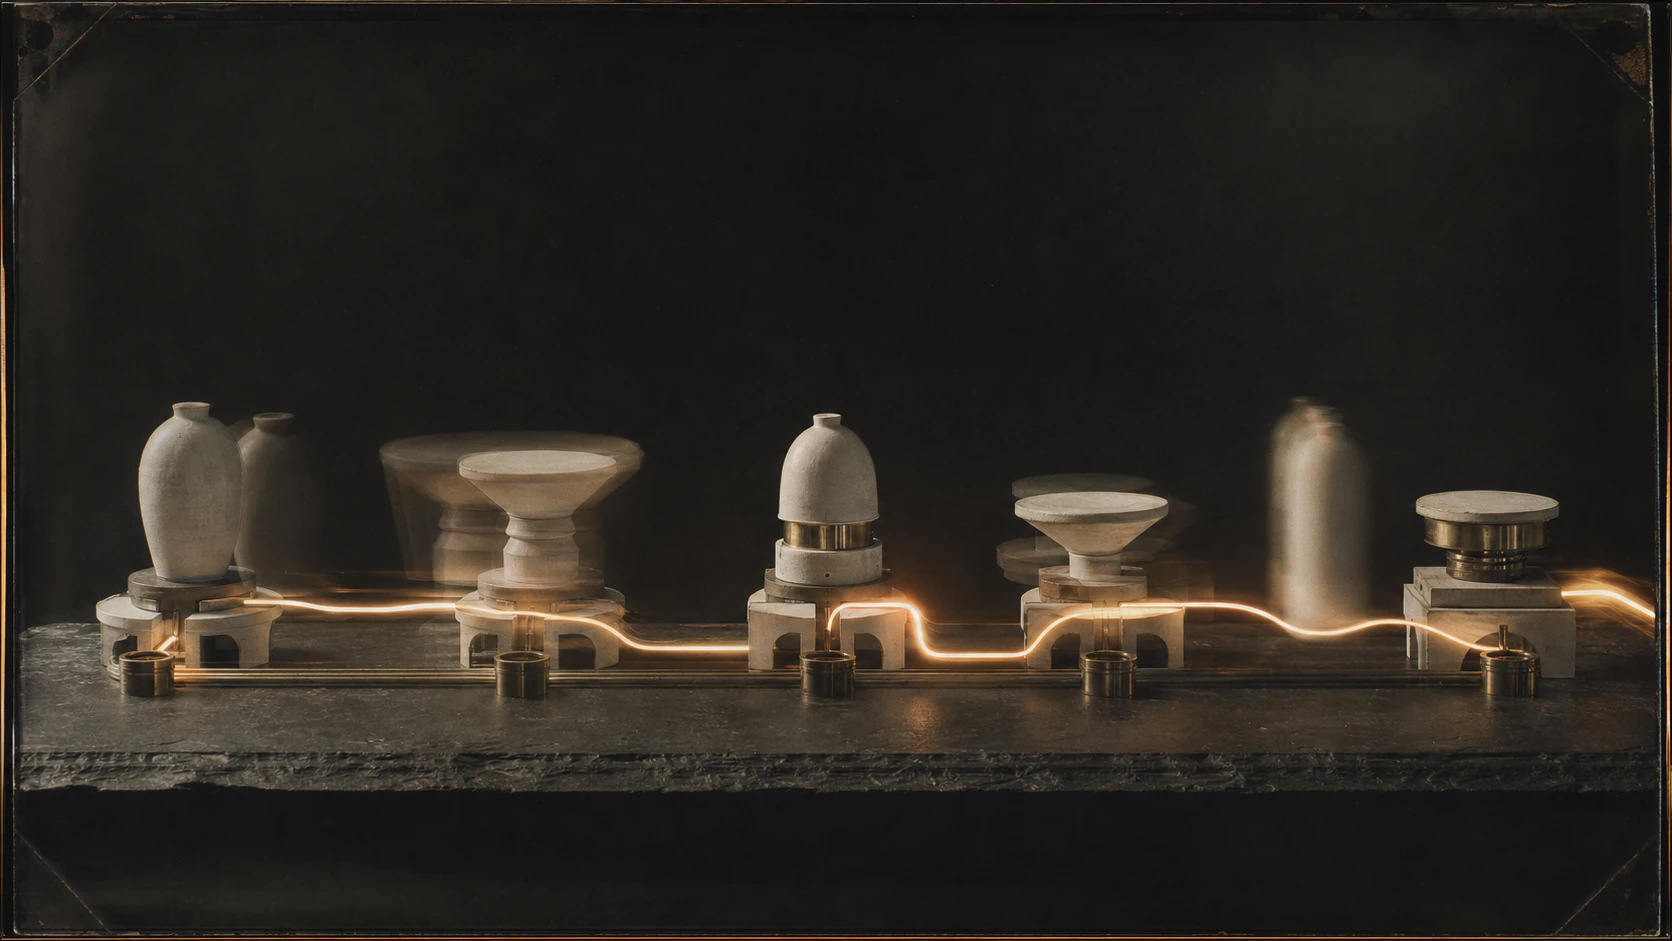
“Replay” can mean several things, and the implementation should be explicit.
Event replay
The system applies recorded events to a known state to derive a sequence. This requires complete and correctly ordered events plus deterministic transition logic. Cloud environments do not always provide that guarantee.
Snapshot interpolation
The system compares observed states and inserts known events between them. It can show a probable sequence with uncertainty.
Deployment reconstruction
The system applies an infrastructure plan or change set to the pre-deployment graph. This represents declared intent and can be compared with observed post-deployment state.
Visual timeline
The interface presents state versions and events in chronological order without claiming it can deterministically reproduce every intermediate state.
The fourth option is often the safest baseline. It gives investigators time context while preserving source truth.
If replay is used for root-cause analysis, late events and corrections must be handled. Version the derived result. Never silently rewrite the historical view without auditability.
Analyze historical dependencies
A temporal graph enables questions that a current graph cannot answer.
Dependency duration
Was a relationship permanent, short-lived, or recurring? A temporary migration path may be active only during releases. A monthly billing dependency may appear infrequently at runtime but remain critical.
Exposure windows
When did an IAM or network path exist, and which resources were reachable during that interval? Security analysis needs the overlap between permissions, resources, and identities.
Shared-resource growth
How did the number and criticality of dependents change? A service can become a single point of failure gradually.
Incident recurrence
Did previous incidents share a topology pattern, dependency, owner boundary, or recovery bottleneck?
Ownership history
Which team owned the workload when a decision was made? Current ownership may differ.
Recovery readiness
Was a fallback present and verified at the time of an incident? Adding it later should not alter the historical conclusion.
These queries support architecture reviews and post-incident learning without relying on memory.
Detect and prioritize drift
Drift is not only a difference between infrastructure code and deployed fields.
Three states can diverge:
- Declared state: What Terraform, CloudFormation, or policy says should exist.
- Actual state: What cloud configuration currently reports.
- Observed state: What runtime evidence suggests is being used.
Examples:
- Terraform declares one target group, while the listener points to another.
- A security group allows a path not present in code.
- A queue subscription exists but has no observed traffic.
- Runtime traces call an external endpoint not declared in configuration.
- A route is technically present but not used by the expected subnets.
The temporal graph shows when divergence began and how topology changed as a result. Prioritization can consider:
- Critical workloads affected
- New or removed paths
- Exposure duration
- Shared dependency
- Evidence confidence
- Customer capability
- Recovery complexity
Not every drift item is harmful. Emergency changes, managed-service updates, and intentional console actions can be valid. The graph provides context for review rather than declaring every difference a defect.
Simulate against historical state
Simulation usually uses current topology, but historical state adds powerful learning.
Teams can ask:
- What would this failure have affected before a migration?
- Would the new architecture have reduced a past incident’s impact?
- Which fallback existed at the time?
- How has blast radius changed?
- Did a remediation actually remove the critical path?
Historical simulation begins by selecting a point-in-time graph. The engine applies a defined failure and propagates through relationships valid at that time. It must use the corresponding workload context and behavior assumptions where available.
Avoid importing today’s knowledge into yesterday without labeling it. If an owner validates that a dependency was required during a past period, record the validation time and its retrospective nature.
Proposed future state can also be modeled by applying an infrastructure plan to the current graph. This creates three comparable versions:
- Historical
- Current
- Proposed
The comparison supports evidence-backed architecture decisions. It still does not guarantee production behavior.
Retention and storage
Temporal data creates cost and governance obligations.
Retention decisions should consider:
- Incident investigation horizon
- Change-review needs
- Security investigation
- Compliance obligations
- Contractual requirements
- Data sensitivity
- Storage and query cost
- Customer offboarding
Different data classes may require different retention:
- Normalized resource state
- Raw provider responses
- CloudTrail events
- Runtime traces
- Flow observations
- User annotations
- Simulation results
Data minimization matters. Store the evidence needed for topology without retaining secret values or unnecessary payloads. Runtime logs and traces can contain sensitive data and may require stronger controls or aggregation.
Storage strategies include:
- Full periodic snapshots
- Delta records
- Event sourcing
- Validity-versioned nodes and edges
- Hybrid checkpoints plus changes
Full snapshots simplify reconstruction but consume more storage. Deltas are compact but make reconstruction and correction harder. A hybrid can create periodic checkpoints with change records between them.
Retention should be tenant-aware and auditable. When access is removed or a contract ends, deletion and export behavior must follow policy.
Query complexity and design choices
Adding time makes graph queries more expressive and more complex.
A current dependency query asks: “What does service A require?” A temporal query asks:
- At which time?
- Based on which observation?
- Under which evidence window?
- Before or after which event?
- With what validity interpretation?
Indexes may be needed on identity, validity intervals, account, Region, resource type, and evidence time. Point-in-time traversal must filter both nodes and edges consistently. Large histories may benefit from partitioning or precomputed snapshots.
Corrections complicate history. If a matching rule mistakenly merged resources, fixing it should preserve an audit trail without leaving future queries wrong. Bitemporal techniques distinguish what the system believed at the time from what it later learned.
User experience is equally important. Most users should not write temporal graph queries. Provide:
- Time picker
- Incident window
- Before-and-after comparison
- Change timeline
- “Show topology at event”
- Edge history
- Evidence freshness
Dense timelines can overwhelm operators. Group routine autoscaling and highlight meaningful topology changes.
Technology choice should follow access patterns. A graph database may support traversal; a relational temporal store may support strong version queries; object storage may preserve raw evidence. A hybrid architecture is often practical. The data model and semantics matter more than product labels.
A hypothetical incident reconstruction
Hypothetical scenario: An API service runs on ECS behind an Application Load Balancer. It retrieves credentials from Secrets Manager through a VPC endpoint and writes to Aurora. A deployment at 14:04 updates task configuration and a security-group rule.
At 14:10, error rates increase. At 14:18, the deployment is rolled back. At 14:22, new tasks replace the unhealthy tasks. Discovery runs again at 14:30.
What the current snapshot shows
The 14:30 snapshot shows:
- Healthy tasks
- Original task configuration
- Restored security-group rule
- Successful database connectivity
A current-only graph cannot explain the incident.
Point-in-time reconstruction
The temporal graph reconstructs:
- 13:55: Pre-deployment topology
- 14:04: Deployment event starts
- 14:06: New task revision observed
- 14:07: Security-group edge no longer permits the Secrets Manager endpoint path
- 14:09: New tasks begin serving traffic
- 14:10: Secret retrieval errors increase
- 14:18: Rollback event
- 14:20: Security-group path restored
- 14:22: Replacement tasks become healthy
The exact transition is shown with observation bounds where needed. The security-group event provides a narrower timestamp than the scheduled snapshot.
Dependency context
The pre-incident graph shows:
API task → VPC endpoint → Secrets Manager secret → database credentials → Aurora
The security-group change affects the endpoint path. Aurora remains healthy. Database connection errors appear because newly started tasks cannot retrieve credentials.
Before-and-after comparison
The diff highlights:
- Task revision changed
- One egress rule removed
- Required endpoint path invalidated
- Rollback restored both
Unrelated tag and autoscaling changes are grouped rather than emphasized.
Causal confidence
The system presents a strong hypothesis, not absolute proof:
- The timing aligns.
- The changed rule is on a required path.
- New tasks show secret retrieval errors.
- Restoring the rule and task revision coincides with recovery.
Investigators can inspect each source.
Historical simulation
The team applies the same rule-removal scenario to the historical graph and reproduces the projected path. They then model a proposed change that adds a separate endpoint security group and preflight validation. The future simulation shows the original shared rule is no longer on that critical path.
This example demonstrates the value of time: the causal edge disappeared before discovery completed, but historical state retained it.
Limits and trade-offs
Temporal records are observations
Unless an authoritative event exists, the system may know a change occurred between two observations, not at an exact instant.
Events can be incomplete
CloudTrail coverage, data-event configuration, external systems, and service behavior vary. Events should not be treated as universal truth.
History can amplify collection mistakes
Incorrect identity resolution or inference can create misleading timelines. Preserve provenance and support correction.
Storage and query cost grows
Fine-grained history and runtime evidence can be expensive. Align fidelity and retention with operational questions.
Privacy and security obligations increase
Historical topology can expose past security paths, identifiers, and ownership. Apply strong access controls, encryption, minimization, retention, and auditability.
Not every change matters
Autoscaling and managed churn create noise. Aggregation must reduce noise without hiding zonal or resource-specific failures.
Historical simulation inherits old uncertainty
Past telemetry and ownership context may be incomplete. Show coverage as it existed at the time.
Key takeaways
- Current snapshots cannot reliably explain past incidents or topology evolution.
- State and events are complementary but not interchangeable.
- Nodes, edges, attributes, and evidence all need time semantics.
- Observation time should not be presented as exact effective time.
- Deleted resources must remain available in historical views.
- Before-and-after comparisons should connect field changes to topology consequences.
- Historical dependencies reveal exposure windows, shared-resource growth, and recurring patterns.
- Drift includes declared, actual, and observed state.
- Historical simulation supports architecture learning but inherits the uncertainty of past evidence.
- Retention, query design, privacy, and cost are central architecture decisions.
Frequently asked questions
Why not store only CloudTrail events?
Events describe actions but may not provide complete normalized state or every transition needed for reconstruction. Combine them with observed configuration state.
Does a temporal graph store every full snapshot?
It can, but many systems use versioned state, deltas, and periodic checkpoints to balance reconstruction simplicity and storage cost.
What happens to a deleted resource?
It should disappear from the current view but remain queryable for its valid historical interval, subject to retention policy.
Can a temporal graph identify root cause automatically?
It can surface changes and dependency paths that support a hypothesis. Temporal proximity does not prove causation, so evidence and human investigation remain necessary.
How long should infrastructure history be retained?
There is no universal period. Retention should follow incident, security, legal, contractual, cost, sensitivity, and offboarding requirements.
Conclusion
Cloud topology is not a picture. It is a changing system whose previous states shape incidents, exposure, recovery, and architecture decisions. A graph that retains only the present can support discovery, but it discards the evidence needed to explain how the present arrived.
A temporal infrastructure graph preserves that evidence through versioned resource state, relationship validity, event context, deleted-resource history, and explicit observation time. It enables point-in-time topology, meaningful diffs, incident reconstruction, drift analysis, and simulation grounded in the state that actually mattered.
The design challenge is not simply storing more data. It is preserving time honestly: distinguishing observation from event, uncertainty from precision, and logical continuity from physical identity. Teams that get those semantics right gain an operational memory for cloud infrastructure—one that can be queried, reviewed, and used to make future changes safer.
Primary sources and further reading
- AWS Config configuration history
- AWS Config supported resource types
- AWS CloudTrail event reference
- AWS CloudTrail event history
- Terraform plan documentation
- CloudFormation change sets
- OpenTelemetry traces
Related StackScopes reading
Continue exploring
Map the path behind the risk.
Explore cloud topology, failure simulation, blast radius, and evidence-backed recovery with StackScopes.