 StackScopes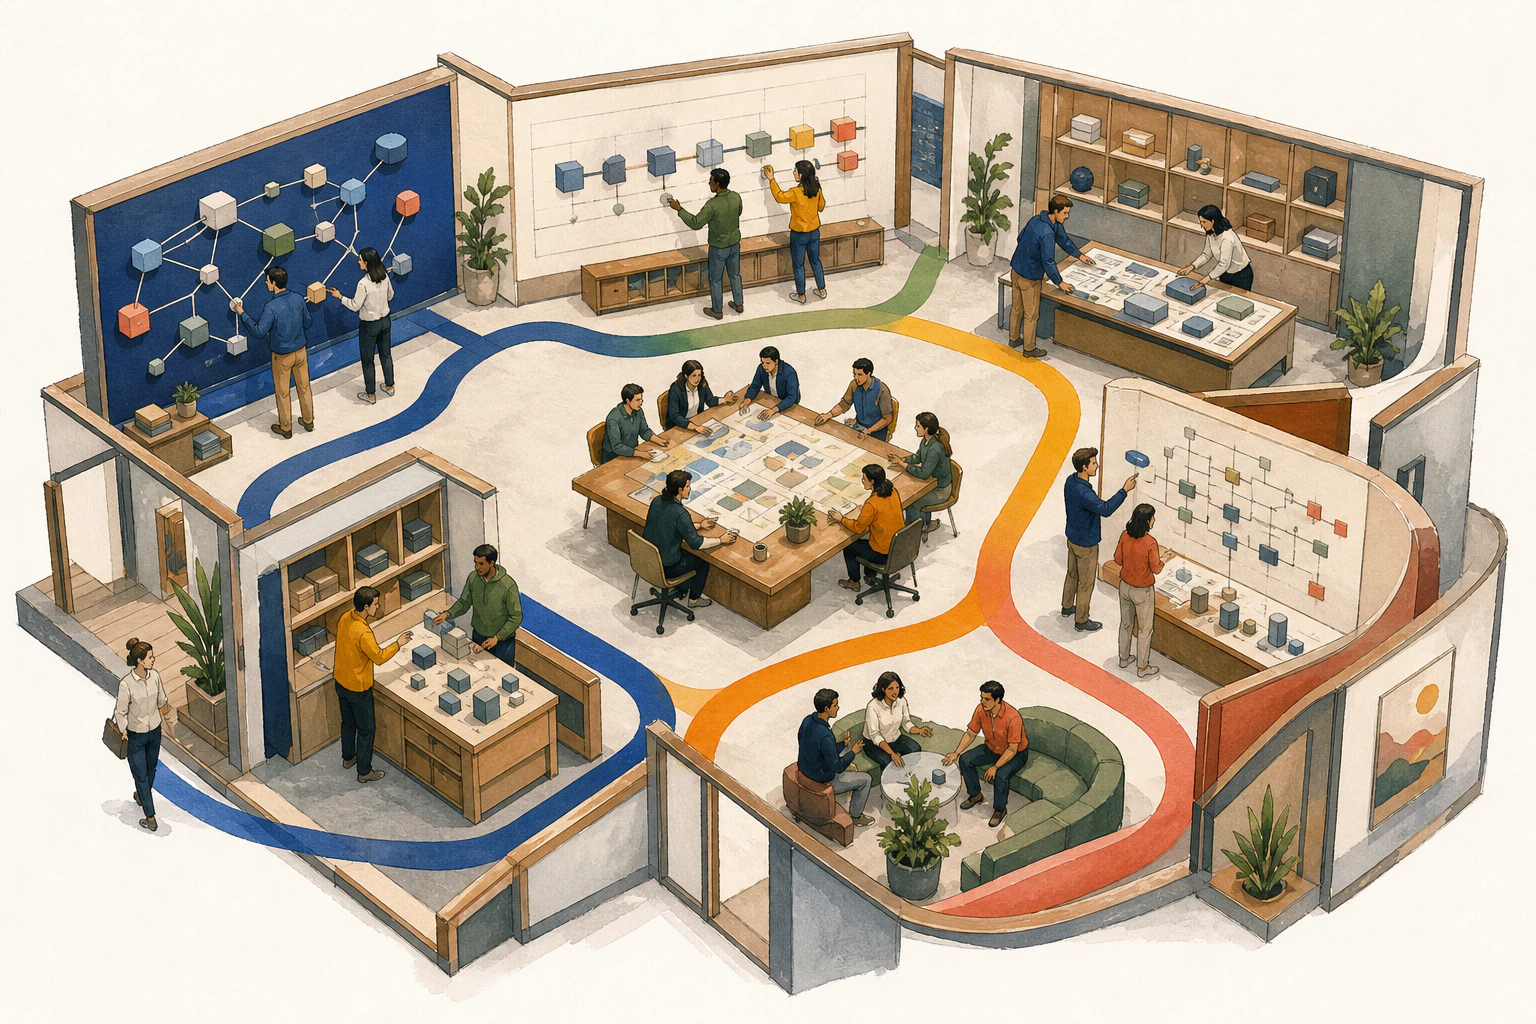
Problem
Cloud incidents scatter evidence across inventory consoles, dashboards, logs, traces, deployment systems, ticket threads, chat, runbooks, and the memories of individual engineers. Each tool can be correct while the response lacks a coherent system view.
Responders lose time translating identifiers, asking who owns a resource, reconstructing changes, and deciding whether an alarm belongs to the same failure path. A resource-health dashboard rarely explains which customer-facing capability depends on that resource. A deployment record rarely shows transitive blast radius. A runbook rarely reflects the topology that exists now.
AI summaries can make the problem worse when they present confident conclusions without sources. During an incident, teams must distinguish observed facts, inferred relationships, working hypotheses, and missing coverage.
The solution is not merely another dashboard or “single pane of glass.” Teams need a workspace structured around the sequence of investigation: orient, scope, correlate, test, decide, act, and verify.
What We Built
StackScopes Unified Operational Investigation Workspace connects:
- Live and point-in-time topology
- Resource configuration and lifecycle
- Dependency evidence
- Change history
- Approved metrics, events, and traces
- Failure-simulation results
- Blast-radius paths
- Customer or tenant-impact context
- Working root-cause hypotheses
- Recovery prerequisites
- Human approvals
- Verification outcomes
An investigation is a durable object with scope, participants, timeline, evidence, hypotheses, decisions, and status. It references source data rather than copying disconnected screenshots.
The workspace separates:
- Fact: directly supported by inspectable evidence.
- Inference: derived from one or more sources under a documented rule.
- Hypothesis: a testable explanation under investigation.
- Decision: a human choice with rationale and approver.
- Action: an executed or proposed step.
- Unknown: missing, stale, inaccessible, or contradictory context.
This vocabulary keeps collaboration precise while pressure is high.
How It Works
Orient from a symptom
An investigation can begin from an alert, resource, change, customer-facing capability, or manual report. StackScopes resolves identifiers and opens the relevant topology neighborhood, account, Region, environment, owner, and freshness state.
The first view avoids displaying the entire cloud. It focuses on entry points, direct dependencies, recent changes, and known shared controls.
Establish an incident window
Responders define the time range around first symptoms. The Infrastructure Timeline shows resource and relationship changes, deployments, policy events, and selected telemetry evidence within that window.
Chronology supports correlation but does not prove causality. A recent change becomes a candidate linked to evidence, not an automatic root cause.
Follow dependency paths
The workspace traces typed paths from suspect resources to workloads and capabilities. It distinguishes runtime, network, identity, encryption, DNS, event, deployment, and recovery relationships.
Blast-radius analysis groups direct, transitive, shared, and potential customer or tenant impact. Redundancy and shared failure domains are visible where modeled.
Build and test hypotheses
A responder records a hypothesis such as “the reporting consumer cannot decrypt its secret after a policy update.” StackScopes links supporting and contradicting evidence: policy change, role path, secret reference, KMS relationship, access-denied event, and queue age.
Model-based failure simulation can test whether the suspected dependency could propagate through known topology. The result remains an analytical scenario, not proof.
Plan controlled recovery
When evidence supports action, the workspace opens a recovery sequence with prerequisites, role requirements, approver, rollback, and checkpoints. Read-only investigation remains separate from a narrowly authorized execution workflow.
Verify and preserve
After action, responders validate control-plane state, application behavior, business capability, backlog, and delayed effects. The workspace records pass, fail, or inconclusive results and retains the investigation timeline for review.
Output and Evidence
The investigation record includes:
- Incident scope and time window
- Current and historical topology
- Affected accounts, Regions, and workloads
- Evidence-backed dependency paths
- Recent relevant changes
- Collection and telemetry gaps
- Facts, inferences, hypotheses, and confidence
- Blast-radius assessment
- Ownership and communication context
- Recovery plan and approvals
- Executed actions
- Verification results
- Open follow-up items
Each claim links to source, timestamp, and scope. A relationship can show whether it came from explicit configuration, policy reachability, runtime observation, or human validation.
The workspace can present an AI-assisted summary, but every material statement should reference bounded evidence. Sensitive fields are minimized and masked, and AI output cannot silently create a new fact.
Customer and tenant-impact context is treated carefully. Infrastructure paths can indicate which capabilities may be affected, but exact customer or revenue impact requires governed business mappings and confirmation.
Collaboration without losing decision context
Investigations often span role changes and handoffs. The workspace records who is acting as incident commander, investigator, service owner, security reviewer, data owner, approver, and executor. A small team may combine roles, but the responsibilities remain visible.
Notes and status updates can link directly to evidence, hypotheses, or actions. When a hypothesis is rejected, its reasoning remains in the record rather than disappearing from chat history. A new responder can see which paths were tested, what evidence contradicted them, and which unknowns remain.
Decision records capture the available evidence and uncertainty at the moment of approval. This is especially important when an urgent recovery action is reasonable despite incomplete information. The record supports later review without implying that responders should have known facts that were unavailable at the time.
Delayed effects and closure
Initial recovery does not end the investigation. Caches, retries, queue backlogs, scheduled jobs, certificate state, and reconciliation can create delayed effects. The workspace supports an observation phase with explicit closure criteria.
Follow-up items can be attached to missing telemetry, ambiguous ownership, outdated runbooks, or incorrect dependency inference. Closing an incident does not automatically mark every model gap resolved.
Why It Matters
Incident response is a coordination problem as much as a detection problem. A shared evidence model helps platform, SRE, application, security, and leadership roles reason from the same context while retaining their responsibilities.
Responders can spend less effort translating resource identifiers and more effort testing the most plausible paths. Changes can be evaluated against topology rather than recency alone. Recovery actions can be tied to prerequisites and verification. Post-incident review gains a preserved record of what the team knew, assumed, decided, and observed.
The workspace does not replace specialist tools. Logs, traces, cloud consoles, deployment systems, and communication channels remain authoritative for their domains. StackScopes connects their approved evidence around the cloud system being investigated.
By keeping the investigation surface scoped to a named incident, teams can separate immediate response from wider architecture work. A responder can preserve a useful question, evidence gap, or ownership issue for follow-up without crowding the active recovery path or losing the reason that the work was created.
Operational Guardrails
- Investigation defaults to read-only evidence.
- Source truth remains linked and inspectable.
- Facts, inferences, hypotheses, and decisions are distinct.
- Missing coverage is visible.
- Chronology is not treated as causality.
- Customer-impact estimates disclose uncertainty.
- Sensitive telemetry and identity data are minimized.
- Tenant and role authorization apply to every view.
- Production actions require separate human approval.
- Action and verification history is auditable.
FAQ
Does the workspace replace observability tools?
No. It connects approved signals from specialist systems to topology, changes, and dependency context. Source systems remain authoritative for detailed telemetry.
Can StackScopes automatically identify root cause?
It can rank and explain hypotheses using available evidence, but root cause requires validation. Incomplete telemetry, application semantics, and external systems can limit conclusions.
How is customer impact calculated?
StackScopes follows dependency paths from affected resources to modeled capabilities and, where governed mappings exist, tenants or customers. Exact impact should be confirmed with business systems and clearly labeled for uncertainty.
Can an investigation execute remediation?
Investigation remains read-only by default. Any controlled action uses a separate role, policy-bound tool, human approval, target validation, and post-action verification.
Related StackScopes links
StackScopes keeps operational evidence, timestamps, assumptions, and confidence visible. Production-impacting recovery remains subject to policy and human approval.