 StackScopes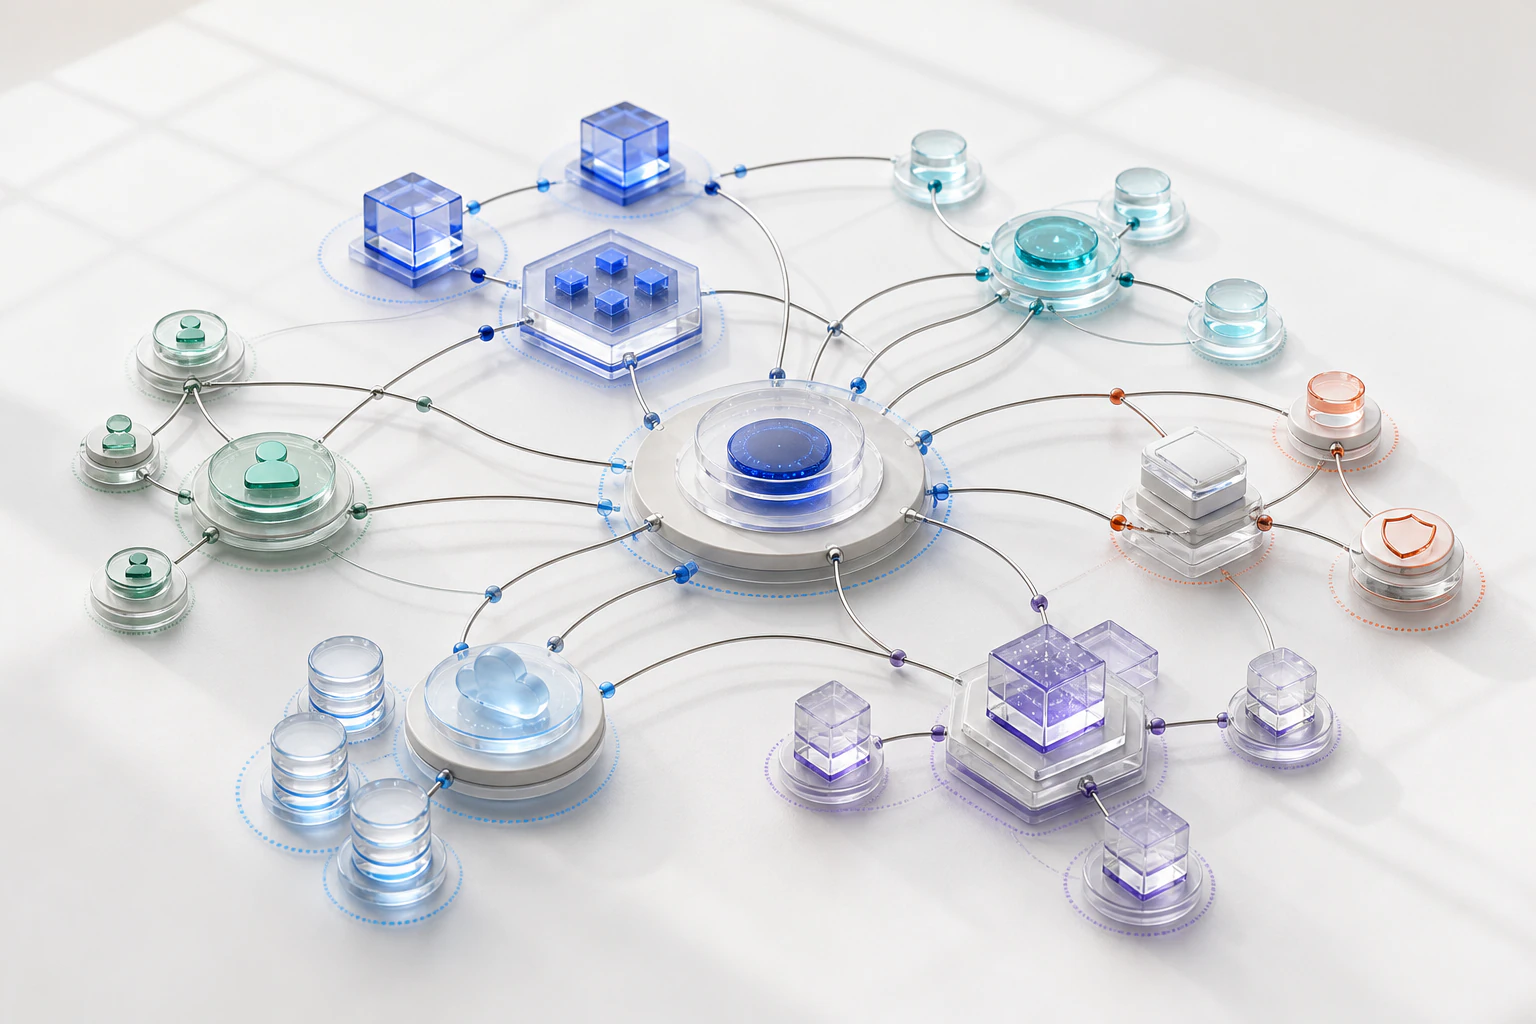
A cloud resource graph becomes operationally useful only when it explains what a relationship means, why the system believes it exists, when it was valid, and how confident an engineer should be in acting on it. A collection of resources connected by vague lines may look impressive, but it cannot safely support incident investigation, change review, or failure simulation.
Table of contents
- Why a resource graph is different from an inventory
- Establishing stable node identity
- Designing edge semantics and direction
- Treating evidence as first-class data
- Expressing confidence without false precision
- Modeling time, cycles, and stale evidence
- Adding ownership and operational context
- Graph storage and query trade-offs
- Building data-quality controls
- Explainability and user validation
- A practical adoption path
- Key takeaways
- Frequently asked questions
Why a resource graph is different from an inventory
An inventory answers “what exists?” A graph must also answer “how does it matter?” An inventory row might show an Application Load Balancer, an ECS service, an RDS cluster, and a KMS key. The graph should show that the load balancer routes to a target group used by the service, that the service opens connections to the database, and that the database relies on the key for encryption. It should distinguish a runtime dependency from simple co-location in the same account.
That difference changes the data model. Inventory attributes describe a resource: account, Region, ARN, tags, configuration, observed state, and collection time. Relationships describe a claim about two entities. A claim needs a type, direction, scope, evidence, observation time, and lifecycle. If the model stores only source and destination IDs, later users have no reliable way to interpret the line.
A useful graph should support concrete questions:
- Which upstream workloads can reach this database?
- Which resources must be available before this service can recover?
- What depends on a shared security group?
- Which route change could isolate a private subnet?
- Which relationships existed at the beginning of an incident?
- Which path is directly configured, and which is inferred from runtime evidence?
- Who owns each affected workload?
The graph does not replace service-native telemetry, infrastructure as code, or human architecture knowledge. It joins those sources into a navigable operational model. Each source has blind spots. A template expresses intended configuration, a cloud API exposes current provider state, an audit log describes actions, and telemetry reveals selected runtime behavior. The graph is useful precisely because it can preserve those differences rather than flattening them into one asserted truth.
AWS Config illustrates why both configuration and relationships matter: its configuration items provide point-in-time views of supported resources and can include how resources relate to one another. That is valuable input, but an operational graph often needs additional application, ownership, runtime, and customer context beyond a provider-native resource relationship.
Establishing stable node identity
Node identity is the foundation. If identity is unstable, every later query produces duplicates, false removals, and broken historical paths.
For AWS resources, an ARN is often the strongest identifier, but it is not universally available or sufficient. Some resource APIs return IDs that are unique only within an account and Region. Some global services have different scoping rules. Some application concepts—such as a checkout service or tenant-facing capability—do not have an ARN at all. A graph therefore needs a canonical identity scheme with explicit namespaces.
A practical key can include:
- Provider or source namespace
- Organization or tenant boundary
- Account or project
- Region or global scope
- Resource type
- Provider-native identifier
The key should remain separate from display names. Names and tags change; identity should not. An RDS cluster renamed through replacement may be a new resource even if engineers think of it as the same logical database. Conversely, a service deployment may preserve the same logical service identity while task instances are replaced continuously. The graph should support both physical resource nodes and logical application nodes rather than forcing one identity model onto both.
Resource aliases help connect identifiers reported differently across systems. A load balancer may appear by ARN in configuration, by DNS name in telemetry, and by a shortened dimension in metrics. Store aliases with source, normalization rules, and validity time. Do not silently merge nodes merely because their names resemble one another.
Identity resolution should be deterministic where possible. Probabilistic matching belongs in a separate reconciliation process with reviewable evidence. If two resources share a tag called service=payments, that is useful grouping evidence, not proof that they are the same node.
Deletion also requires care. A missing resource is not immediately proof of deletion. Discovery may have been throttled, a Region may have failed, or permissions may have changed. Mark an observation as missing, preserve the previous node, and require corroboration or a suitable absence policy before closing its validity interval.
Hypothetical example: one name, three identities
Consider an illustrative service called “orders.” Its CloudFormation stack contains an ECS service, an Application Load Balancer, and an Aurora cluster. Telemetry also uses service.name=orders.
The graph should not collapse all four concepts into one node. It can create a logical orders-service node, then connect it to deployed resources with relationships such as RUNS_ON, EXPOSED_BY, and READS_FROM. This preserves operational meaning: the logical service can remain stable across deployments, while the physical ECS service and task revisions have their own lifecycles.
Designing edge semantics and direction
An edge should be a typed, directed statement. “A is connected to B” is usually too ambiguous to support analysis.
Useful relationship types might include:
ROUTES_TOREADS_FROMWRITES_TOAUTHENTICATES_WITHENCRYPTED_BYASSUMES_ROLEMEMBER_OFRUNS_INRESOLVES_TOPUBLISHES_TOSUBSCRIBES_TOOBSERVED_CALL_TOOWNED_BY
Direction must follow a documented convention. For impact analysis, teams often want edges to represent dependency direction: application DEPENDS_ON database. For traffic analysis, they may prefer flow direction: application CONNECTS_TO database. Both can work, but mixing them creates dangerous traversals. One approach is to store specific semantic edges and derive a normalized DEPENDS_ON view for impact calculations.
Edge semantics should state whether the relationship is structural, permission-based, potential, or observed. An IAM policy that permits access is not proof that access occurs. A route that makes a destination reachable is not proof that an application uses it. A DNS record pointing to a load balancer is configuration evidence, while a trace showing requests through it is runtime evidence. These can coexist as separate edges or as separate evidence records attached to a consolidated relationship.
Cardinality matters. A security group attached to many network interfaces is a shared control-plane dependency, but it is not equivalent to each workload calling every other workload that shares the group. Similarly, membership in the same subnet is not a dependency. Resist creating edges simply because two items have a common parent. Overconnected graphs obscure critical paths and inflate blast-radius results.
Relationship properties may include port, protocol, action, route priority, DNS record type, policy effect, environment, and discovered account. Keep properties relevant to the semantic edge; avoid copying entire source documents into graph properties.
Define a relationship registry. For each type, document:
- Expected source and destination node types
- Direction
- Operational meaning
- Allowed evidence sources
- Whether it can drive impact traversal
- Whether it implies availability dependence
- Whether it is temporal
- How it expires or is contradicted
This registry functions like an API contract for collectors, inference rules, queries, and interface labels.

Treating evidence as first-class data
Evidence is what turns a graph assertion into an explainable model. Every material relationship should answer: “Why do we think this is true?”
Evidence can come from:
- Cloud configuration APIs
- AWS Config configuration items
- CloudFormation or Terraform declarations
- CloudTrail management events
- VPC Flow Logs
- Distributed traces
- Application configuration
- DNS records
- IAM policies
- Tags and naming conventions
- Deployment manifests
- Human confirmation
Do not treat these sources as interchangeable. A Terraform reference is strong evidence of intended dependency. A successful trace is strong evidence that a call occurred during the observation period. A security-group rule is evidence of possible network reachability. A naming match is a heuristic. Store the source class and exact supporting fields.
An evidence record should usually include:
- Evidence ID
- Source system
- Collection or event time
- Source account and Region
- Relevant resource identifiers
- Extracted fields or a safe reference to raw data
- Inference rule and version
- Collector version
- Freshness or expiration policy
- Sensitivity classification
- Contradiction state
Preserve enough detail to reproduce the conclusion without exposing unnecessary secrets. An application configuration may reveal a secret value; the graph usually needs only the target reference and the fact that a mapping was observed. Redact or tokenize sensitive values before storage.
Multiple evidence records can support one relationship. That matters during incidents. A declared dependency plus recent runtime calls is stronger than either alone. If runtime evidence disappears, the declared relationship may remain valid, but the interface should show that observation is stale.
CloudTrail can help attribute create, update, and delete API actions. Its default Event history has scope and retention limitations, including a 90-day view of management events within an account and Region, so a graph should not treat a missing Event history result as proof that no change occurred. Long-term or organization-wide history requires deliberate logging architecture.
Expressing confidence without false precision
Confidence communicates how strongly available evidence supports a relationship. It is not the same as probability that an outage will occur, and it should not disguise uncertainty behind an impressive decimal.
A practical model can use explainable bands:
- Confirmed: directly configured or human-validated, with current evidence
- Strong: multiple independent sources agree
- Moderate: one reliable source or several weaker signals
- Tentative: heuristic evidence that needs review
- Contradicted: sources materially disagree
If numeric scoring is useful internally, expose the factors behind it. For example, a score may consider source reliability, recency, corroboration, identifier match quality, and contradictions. Do not show “87.3% confidence” unless that number is calibrated and users understand what it means. False precision encourages unsafe automation.
Confidence should change as evidence changes. Runtime observation decays; durable configuration may remain strong until replaced. Human validation should also have an expiry or review condition because architecture changes.
Separate confidence from criticality. A tentative dependency to a payment database could be highly important to investigate. A confirmed relationship to a noncritical test queue may be low priority. Prioritization should consider both.
Explain uncertainty explicitly. “Observed in traces during the last seven days” is more actionable than “medium confidence.” “Permitted by IAM policy but no recent calls observed” tells an engineer what to verify.
Modeling time, cycles, and stale evidence
Cloud systems are temporal. Nodes and edges should have validity intervals or equivalent versioned state. At minimum, preserve:
- First observed
- Last observed
- Valid from
- Valid to
- Evidence time
- Collection time
Observation time and effective time may differ. A collector can discover a change at 10:05 that took effect at 10:01. An audit event may establish the earlier effective time. Keep both rather than rewriting history.
Temporal modeling enables point-in-time queries: “show the topology at 09:42,” “what changed before latency rose?” and “did this dependency exist during the outage?” It also prevents today’s architecture from contaminating yesterday’s investigation.
Cycles are normal. Two services may call each other, a queue consumer may write status back to a producer-owned store, and DNS or identity paths can form loops. Do not remove cycles to make the graph look like a tree. Instead, distinguish traversal purpose. A recovery-order query may condense strongly connected components and flag them for coordinated recovery. A request-flow view may show both directions.
Staleness must be visible. Each evidence class needs a freshness expectation. A resource API snapshot from minutes ago may be current; a trace last seen a month ago may not prove a present runtime path. Do not delete stale edges automatically if doing so would hide a possibly dormant but critical path. Mark them stale, reduce confidence if appropriate, and allow filters.
Contradictory evidence is also a useful state. If a template references a database but runtime calls now reach a different endpoint, the graph should show drift or uncertainty, not arbitrarily select one truth.
Adding ownership and operational context
Infrastructure has meaning only in a human and product context. Add nodes or attributes for:
- Workloads
- Services
- Environments
- Teams
- Runbooks
- Repositories
- Deployment pipelines
- Business capabilities
- Tenants or customer segments where appropriate
Ownership should be temporal and sourced. A tag may indicate team=platform, while a service catalog says team=payments. Store both and expose the conflict. Do not use ownership tags as unquestioned truth.
Customer or tenant mapping requires particular care. Avoid copying personal information into the graph. Prefer opaque tenant identifiers and access-controlled relationships. A resource shared across tenants may support impact analysis, but the interface should reveal only information permitted for the viewer.
Operational context changes graph queries. Instead of returning 800 affected resources, a blast-radius view can group them into four workloads owned by three teams. During recovery, the graph can identify repository, runbook, and approval owner. During change review, it can reveal that a supposedly internal queue supports a customer-facing workflow.
Graph storage and query trade-offs
There is no universally correct storage engine. Choose based on query shapes, scale, update patterns, consistency needs, team skills, and operational burden.
A native property graph can make multi-hop traversal and path queries expressive. A relational database can model nodes, edges, evidence, and temporal versions effectively, particularly when the team needs strong transactions and familiar operations. Search indexes can accelerate discovery and faceting but should not become the authoritative relationship store. Object storage is appropriate for immutable raw evidence and snapshots.
Common query patterns include:
- Neighborhood expansion
- Reachability
- Shortest or most relevant path
- Reverse dependency traversal
- Subgraph extraction
- Temporal reconstruction
- Cycle detection
- Centrality or shared-dependency analysis
- Filtering by account, Region, environment, or owner
Traversal limits are essential. An unconstrained query across high-degree nodes can be expensive and misleading. Limit by relationship type, confidence, validity time, environment, and operational semantics. A graph database does not remove the need for a careful domain model.
Write paths also matter. Discovery pipelines produce partial batches and retries. The system should apply idempotent updates, preserve provenance, and avoid closing relationships merely because one collector failed. Consider separating immutable observations from derived current-state projections.

Building data-quality controls
Graph quality is not a one-time migration task. It requires continuous controls.
Useful checks include:
- Duplicate canonical IDs
- Dangling edges
- Invalid source or destination types
- Missing evidence
- Unknown relationship types
- Impossible Region combinations
- Stale collectors
- Sudden resource-count drops
- Sudden edge-count spikes
- Excessive heuristic-only relationships
- Conflicting ownership
- Unclosed validity intervals
- Clock-skew anomalies
Set expectations per collector. If one account normally reports thousands of resources and suddenly reports none, quarantine the observation instead of declaring mass deletion. Track coverage by service, account, Region, and resource type. “No dependencies found” has meaning only when collection coverage is known.
Inference rules need tests and versioning. Test with realistic fixtures, including negative cases. A rule should not connect every Lambda function to every secret merely because both share a prefix. Monitor precision through human feedback and investigate changes after rule releases.
Quality dashboards should separate ingestion health, identity resolution, relationship evidence, freshness, and user validation. A single “graph quality score” can hide the source of a problem.
Explainability and user validation
An engineer should be able to open any important edge and see:
- Plain-language relationship meaning
- Direction
- Source and destination identities
- Supporting evidence
- First and last observation
- Confidence and reasons
- Conflicting evidence
- Inference rule
- Relevant configuration fields
This makes the graph reviewable during high-pressure work. It also lets users correct the model.
Validation controls should allow a user to confirm, reject, annotate, or scope a relationship. Rejection should not erase the original observation. Store feedback as evidence, identify who made it, and keep an audit trail. If the underlying configuration later changes, the validation may need review.
Avoid asking users to curate the entire graph manually. Prioritize review where uncertainty and criticality intersect: tentative edges on critical paths, ownership conflicts, newly introduced shared dependencies, and relationships that substantially expand predicted blast radius.
Explainability also improves automation safety. A recovery recommendation should cite the dependencies that determine order. A change-risk result should cite affected paths. A simulation should state assumptions. Graph output without evidence should not trigger production actions.
A practical adoption path
Start with a bounded environment and a few high-value relationship types. Establish canonical identity, collect current configuration, and retain raw observations. Connect logical workloads and owners. Then validate the paths around one critical application.
Next, add temporal history and audit events. Compare declared and observed relationships. Introduce confidence bands and a review workflow. Measure coverage and correction rates rather than celebrating graph size.
Only after the model is explainable should teams rely on it for automated impact analysis or recovery sequencing. Even then, present assumptions and require human approval for production-impacting actions.
Hypothetical example: evaluating a database change
Suppose a platform team plans to replace a security group attached to an Aurora cluster. The graph shows three applications with CONNECTS_TO evidence from traces, two Lambda functions permitted by IAM and configuration references, and one batch job inferred from a shared secret name.
A useful change review does not report “six dependencies” as if all were equivalent. It labels three runtime-confirmed callers, two configured callers, and one tentative caller. It shows owners and last-observed times. The team can verify the batch job, test the proposed network rules, and route approvals to the affected service owners. Evidence and confidence make the graph actionable.
Trade-offs and limitations
A richer graph costs more to collect, store, reason over, and secure. Runtime telemetry increases fidelity but may sample traffic or omit dormant paths. Configuration data is broad but cannot prove behavior. Human validation adds meaning but ages. Temporal history supports investigation but increases retention and query complexity.
Completeness is not attainable in an absolute sense. External SaaS dependencies, application-level feature flags, credentials embedded in unsupported systems, and emergency manual changes may remain invisible. The right goal is explicit coverage, visible uncertainty, and progressive improvement.
The graph can also reveal sensitive architecture. Apply tenant boundaries, role-based access, data minimization, audit logging, and careful treatment of customer relationships. “Read-only discovery” describes source-system permissions; it does not remove the obligation to protect collected metadata.
Key takeaways
- A cloud resource graph is a set of typed, directed, evidenced claims—not an inventory with decorative lines.
- Stable identity and explicit namespaces prevent duplicate and broken history.
- Edge semantics must distinguish configuration, permission, potential reachability, and observed behavior.
- Evidence, provenance, time, and confidence belong in the core model.
- Confidence should be explainable and separate from criticality.
- Cycles and contradictions are real operational information.
- Ownership and workload context turn resource paths into actionable impact.
- Data-quality controls and user validation are continuous processes.
- Automation should cite graph evidence and preserve human control.
Frequently asked questions
Is a cloud resource graph the same as a CMDB?
No. A CMDB can store resources and relationships, but many implementations emphasize records and manually maintained associations. An operational cloud graph typically ingests provider state continuously, preserves evidence and time, and supports dependency traversals. A well-designed CMDB could implement these capabilities; the distinction is functional, not merely a product label.
Should every discovered relationship affect blast-radius analysis?
No. Membership, ownership, possible permission, runtime calls, and availability dependencies have different meanings. Only relationship types with documented impact semantics should drive a given traversal. Confidence, validity time, environment, and redundancy should also constrain analysis.
How should a graph handle missing telemetry?
Treat missing telemetry as uncertainty, not proof of no dependency. Confirm collection coverage, sampling, and observation window. Preserve configuration evidence and label runtime status accurately.
Can tags define service ownership?
Tags are useful evidence, but they may be absent, stale, or inconsistent. Compare them with service catalogs, repositories, deployment systems, and human validation. Preserve conflicts rather than silently overwriting them.
When is a graph ready for recovery automation?
When relevant identities and relationships are stable, evidence is inspectable, coverage is understood, temporal state is available, and recommendations can explain their assumptions. Production-impacting remediation should still be policy-bound, auditable, and human-approved.
Conclusion
The value of a cloud resource graph does not come from the number of nodes it can draw. It comes from reliable operational meaning. Stable identities, precise edge semantics, evidence, confidence, and time allow engineers to ask hard questions without pretending the model is omniscient.
StackScopes approaches the graph as an explainable digital twin: a living model that connects infrastructure state with runtime observations, changes, ownership, and operational context. That foundation can support safer simulation, clearer blast-radius analysis, and evidence-backed recovery while preserving the uncertainty engineers need to see.
Official references
- How AWS Config works
- AWS Config configuration items
- AWS CloudTrail event history
- AWS CloudTrail record contents
- AWS CloudFormation drift detection
Related StackScopes reading
Continue exploring
Map the path behind the risk.
Explore cloud topology, failure simulation, blast radius, and evidence-backed recovery with StackScopes.