 StackScopes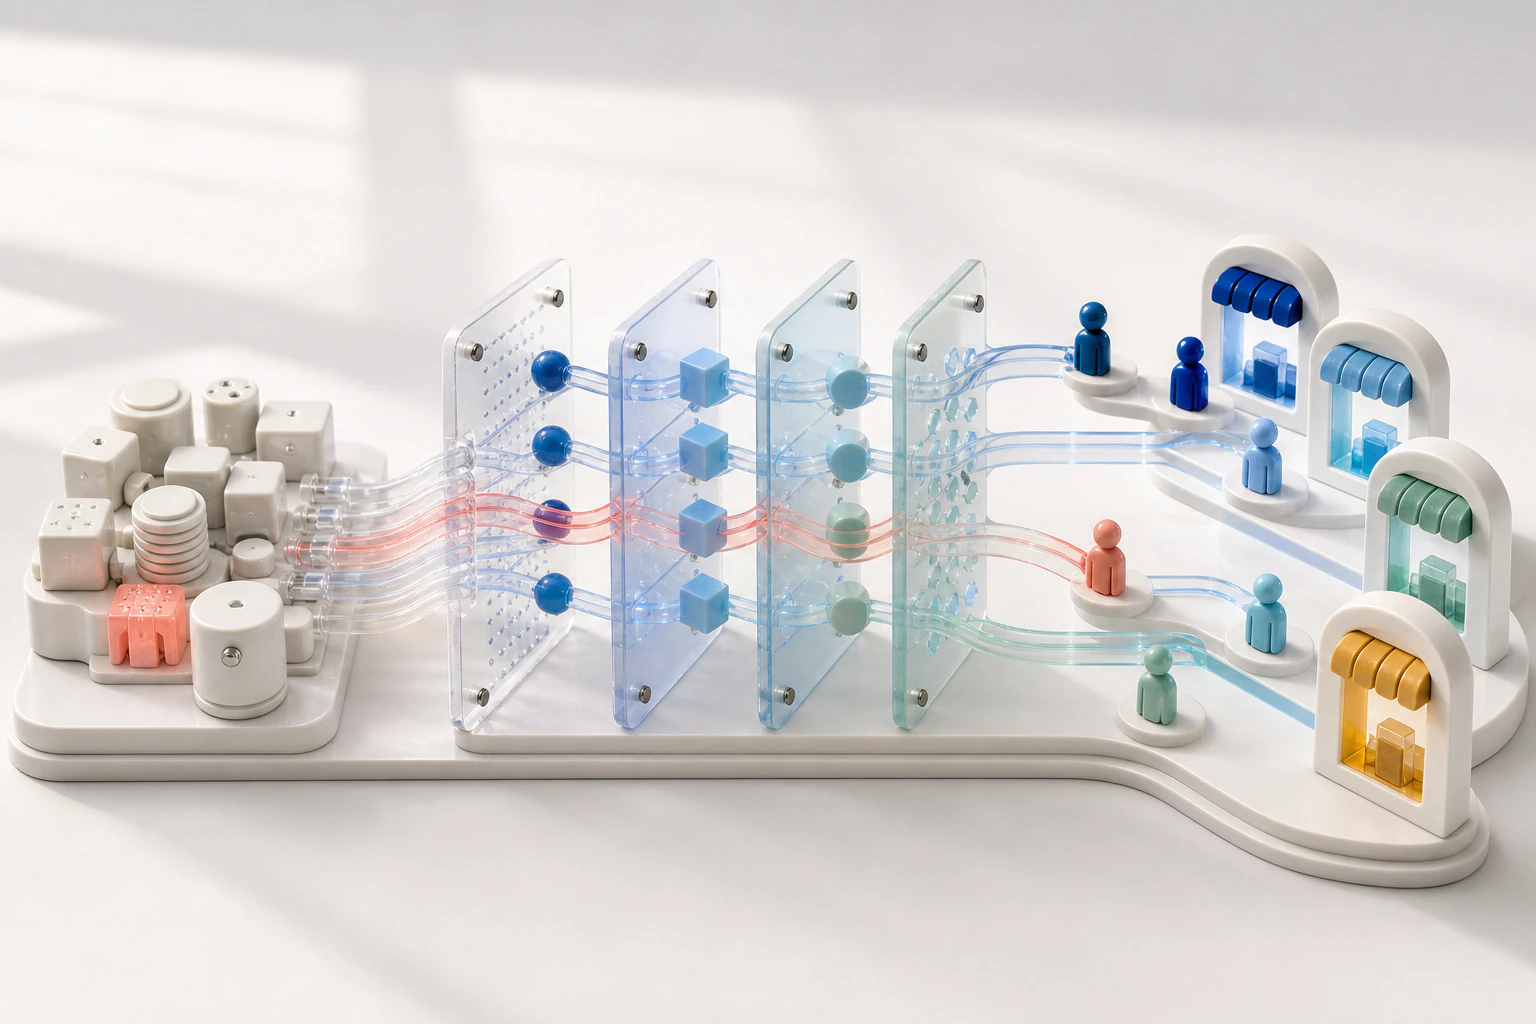
A red infrastructure signal tells an operations team that something is wrong. It rarely tells them who is affected, which customer journey is degraded, whether redundancy is working, or what to restore first. Closing that gap requires a model that connects resource state to workloads, dependencies, capabilities, tenants, and time.
Table of contents
- Why resource health is not customer impact
- Build the context chain
- Model workloads and service ownership
- Understand dependency paths and redundancy
- Add criticality and customer journeys
- Introduce tenant-aware impact
- Account for time-to-impact
- Prioritize incidents and communicate clearly
- Treat revenue estimates carefully
- Hypothetical checkout incident
- Implement a practical impact-analysis workflow
- Trade-offs and limitations
- Key takeaways
- Frequently asked questions
Why resource health is not customer impact
Cloud platforms expose a large volume of state: instance checks, database events, error rates, queue depth, load-balancer target health, deployment status, and API changes. Each signal is valuable, but a resource can be unhealthy without affecting customers. Conversely, customers can experience a serious failure while every underlying resource reports “healthy.”
Consider a cache node that fails over cleanly. The resource generated an event, yet the application continued serving requests. Compare that with a valid but incorrect DNS change: each target may remain individually healthy while traffic goes to the wrong endpoint. Health describes an observed condition at one layer. Impact describes the consequence for a capability or user.
This distinction explains why incident channels often begin with questions that dashboards cannot answer:
- Is the customer-facing service actually down?
- Which markets or tenants are affected?
- Is the problem limited to writes?
- Are retries or fallbacks masking the failure?
- When will a growing queue become visible to customers?
- Which shared dependency connects these alerts?
- Who owns the affected capability?
Teams often try to answer by searching runbooks, architecture diagrams, service catalogs, dashboards, and tribal knowledge. Those sources decay at different rates. A static diagram may show the main database but omit a queue introduced last quarter. A service catalog may identify an owner without showing technical dependencies. Telemetry may show calls but not their business purpose.
Cloud customer impact analysis joins these layers. It is not a magic score generated from resource alarms. It is a reasoned traversal from observed conditions through known relationships to customer-facing capabilities, with evidence and uncertainty visible.
Build the context chain
A useful context chain can be represented as:
Resource state → technical dependency → workload → business capability → customer journey → tenant or segment
Each link answers a different question.
Resource state captures what is observed: unavailable database writer, rising queue age, unhealthy target, revoked permission, or changed route.
Technical dependency explains how failure may propagate: the API writes to the database, a worker consumes the queue, the edge relies on DNS, or encryption operations require a KMS key.
Workload groups resources into an operable system with an owner, deployment lifecycle, environment, and resilience design.
Business capability describes what the system enables: checkout, invoice generation, account login, report export, or notification delivery.
Customer journey captures an ordered experience. “Complete a purchase” may involve catalog, cart, payment authorization, order creation, and confirmation.
Tenant or segment identifies which population is exposed to the affected path without unnecessarily copying personal information.
The chain should be modeled as evidence-backed relationships, not a collection of labels assumed to be correct forever. For example, a trace can show that the checkout API calls an order service. Application configuration may establish the database endpoint. A service catalog may establish ownership. A product map may link the order service to the checkout journey. Each relationship should retain its source and observation time.
Some organizations will not have all layers. Start with resources, workloads, and owners; then add critical capabilities. The model becomes more useful incrementally. Avoid delaying all impact analysis until an ideal enterprise taxonomy exists.
Model workloads and service ownership
Resource-level alerts become manageable when resources are grouped into logical workloads. A workload may include load balancers, containers, functions, databases, queues, secrets, identity roles, DNS records, and deployment pipelines. Grouping only by tags is convenient but fragile: tag conventions differ, shared resources support multiple workloads, and emergency resources may be untagged.
Use multiple signals:
- Infrastructure-as-code stack membership
- Deployment manifests
- Service catalog entries
- Resource tags
- Telemetry service names
- Repository metadata
- Naming conventions
- Human validation
Preserve conflicts. If tags say “platform” owns a queue but the catalog says “orders,” display the discrepancy. Silently selecting one source may route an incident to the wrong team.
Ownership is more than a team name. Operationally useful ownership includes escalation path, repository, runbook, service tier, approval authority, and last review. It should also have a validity period because reorganizations change responsibility.
Shared resources need explicit modeling. A central DNS zone, identity provider, event bus, or database cluster can support several workloads. Assigning it to one team does not remove the dependence of other teams. The graph should distinguish operator ownership from consumer relationships.
Environment boundaries are equally important. A development resource with a familiar name must not be connected to a production workload merely because tags match. Scope identity and relationships by account, Region, environment, and organization boundary.

Understand dependency paths and redundancy
Customer impact travels through paths, not isolated edges. If a database writer fails, the order service may lose write capability. Checkout may still load products but fail at final submission. A dependency traversal should preserve those semantics.
Different relationships propagate different failure modes:
WRITES_TOcan expose write availability and durability risk.READS_FROMmay affect lookup or page rendering.AUTHENTICATES_WITHcan block all protected requests.PUBLISHES_TOcan delay asynchronous processing.RESOLVES_TOcan prevent traffic from reaching otherwise healthy systems.ENCRYPTED_BYcan block data access if key operations fail.
A graph that treats every line as generic “depends on” will overstate impact. Store relationship type, direction, evidence, and relevant mode.
Redundancy changes the result. Two healthy targets behind a load balancer may absorb one target’s failure. A Multi-AZ database configuration can respond differently from a single-instance deployment. A secondary Region may exist but require manual traffic shift. Fallbacks may preserve reads while writes fail. The impact model should ask:
- Is an alternative path available?
- Is it active, warm, or merely documented?
- Has it been observed or tested?
- Does it preserve full functionality?
- What capacity does it have?
- Does failover require a control-plane action?
- Does the fallback share the failed dependency?
Do not convert configuration into a guarantee. Redundant components can share a hidden failure domain, and an untested standby may not recover as expected. Represent redundancy as a modeled mitigation with evidence and confidence.
Path ranking also matters. A query can return hundreds of theoretical paths through permissive IAM or network relationships. Rank direct configuration and observed runtime paths above weak heuristics. Allow engineers to inspect lower-confidence paths when the incident remains unexplained.
Add criticality and customer journeys
Not every workload has equal business importance. Criticality gives teams a way to prioritize, but it must be defined deliberately.
Useful factors include:
- Customer-facing versus internal
- Read versus write path
- Data durability
- Safety or regulatory consequence
- Transaction timing
- Workaround availability
- Dependency centrality
- Recovery objective
- Peak-period sensitivity
Avoid one universal “critical” label. A reporting pipeline may tolerate delayed processing but not lost records. Login may be globally critical but have a working session-cache path for existing users. Billing can be time-sensitive at month end. Capture dimensions rather than compressing all nuance into a single color.
Customer journeys provide a more realistic lens. A journey is an ordered set of capabilities, and partial failures matter. A shopper may browse and add items to a cart but fail to submit payment. Describing the incident as “website degraded” hides the decisive step.
For each journey, identify:
- Entry point
- Required capabilities
- Optional enhancements
- Data writes
- External dependencies
- Fallback behavior
- Success signal
- Owner
- Key segments
Synthetic tests, business metrics, and traces can provide evidence that the journey is working. None is complete alone. A synthetic checkout may use one region and one payment route; business metrics can lag; traces may be sampled. Show source coverage.
Introduce tenant-aware impact
Multi-tenant SaaS systems need impact analysis that distinguishes shared and isolated infrastructure. A failure may affect all tenants, a shard, a geography, a plan tier, or one customer-specific integration.
Model tenant relationships using privacy-conscious identifiers. The graph often needs an opaque tenant ID, shard placement, regional routing, and workload relationship—not names, emails, or other personal data. Apply access controls so a user sees only permitted tenant context.
Tenant mapping can come from:
- Shard or partition metadata
- Routing configuration
- Deployment placement
- Feature entitlement
- Data-residency region
- Dedicated-resource association
- Integration configuration
Each mapping has a lifecycle. A tenant may migrate between shards, so point-in-time impact must use the placement that existed during the incident. Current placement cannot safely answer a historical question.
Shared services complicate counts. If an identity provider is affected, every tenant may be exposed, but existing sessions could continue temporarily. If one database shard is unavailable, only assigned tenants may be affected. If a message consumer fails, impact may depend on which tenants generated events during the window.
Avoid presenting an exact affected-customer count unless the model has the necessary evidence. Prefer bounded language:
- “Tenants mapped to shard 3 are potentially affected.”
- “New login attempts may fail; existing sessions have not been evaluated.”
- “Impact is confirmed for the EU processing path.”
- “The dependency is shared, but customer-visible degradation is not yet observed.”
That language is more useful than a false certainty.
Account for time-to-impact
Failures do not always become visible immediately. Time-to-impact is the interval between a technical condition and a customer consequence.
Examples:
- A worker stops, but queued jobs meet their service window for another hour.
- A cache fails, and database load rises gradually toward saturation.
- A certificate expires at a known time.
- A credential rotation removes an old secret after a grace period.
- A database replica lags until reads become materially stale.
- A disk approaches capacity and will exhaust at the current growth rate.
Modeling time-to-impact improves priority. A low-urgency resource event may need immediate action if it threatens a critical path in minutes. A confirmed failure with a long buffer may permit a safer, reviewed recovery.
Inputs can include queue depth and drain rate, retry budgets, cache TTL, token expiry, certificate expiry, replication lag, capacity trends, and recovery duration. These are estimates. Show observation time, assumptions, and confidence.
Time also affects blast radius. At minute zero, only an internal queue is degraded. At minute 20, delayed notifications become visible. At minute 60, a downstream reconciliation deadline may be missed. Represent impact as a timeline rather than a static list.
Prioritize incidents and communicate clearly
An impact view should help incident commanders decide what needs attention first. Useful dimensions include:
- Confirmed versus potential customer impact
- Critical journey affected
- Number or class of tenants exposed
- Time-to-impact
- Data-integrity risk
- Working fallback
- Propagation confidence
- Recovery complexity
- Owner availability
Do not turn these dimensions into an opaque severity score. Explain why the system recommends a level. For example:
High priority because order submission is failing for tenants routed to shard 3, no verified write fallback exists, and queue age is expected to cross the processing objective within 18 minutes.
Communication should separate facts, hypotheses, and unknowns:
Facts: database writer is unavailable; checkout write errors increased; shard 3 routes to the cluster.
Hypothesis: customers assigned to shard 3 cannot complete new orders.
Unknown: whether retry behavior is preserving some transactions; whether manual failover will complete inside the objective.
This structure prevents an early hypothesis from becoming institutional truth. Update timestamps and evidence links allow stakeholders to judge freshness.
Status messages should use customer language, not internal resource IDs. “Some customers cannot submit orders” is clearer than “Aurora writer endpoint unavailable.” Internal incident notes should retain both.
Treat revenue estimates carefully
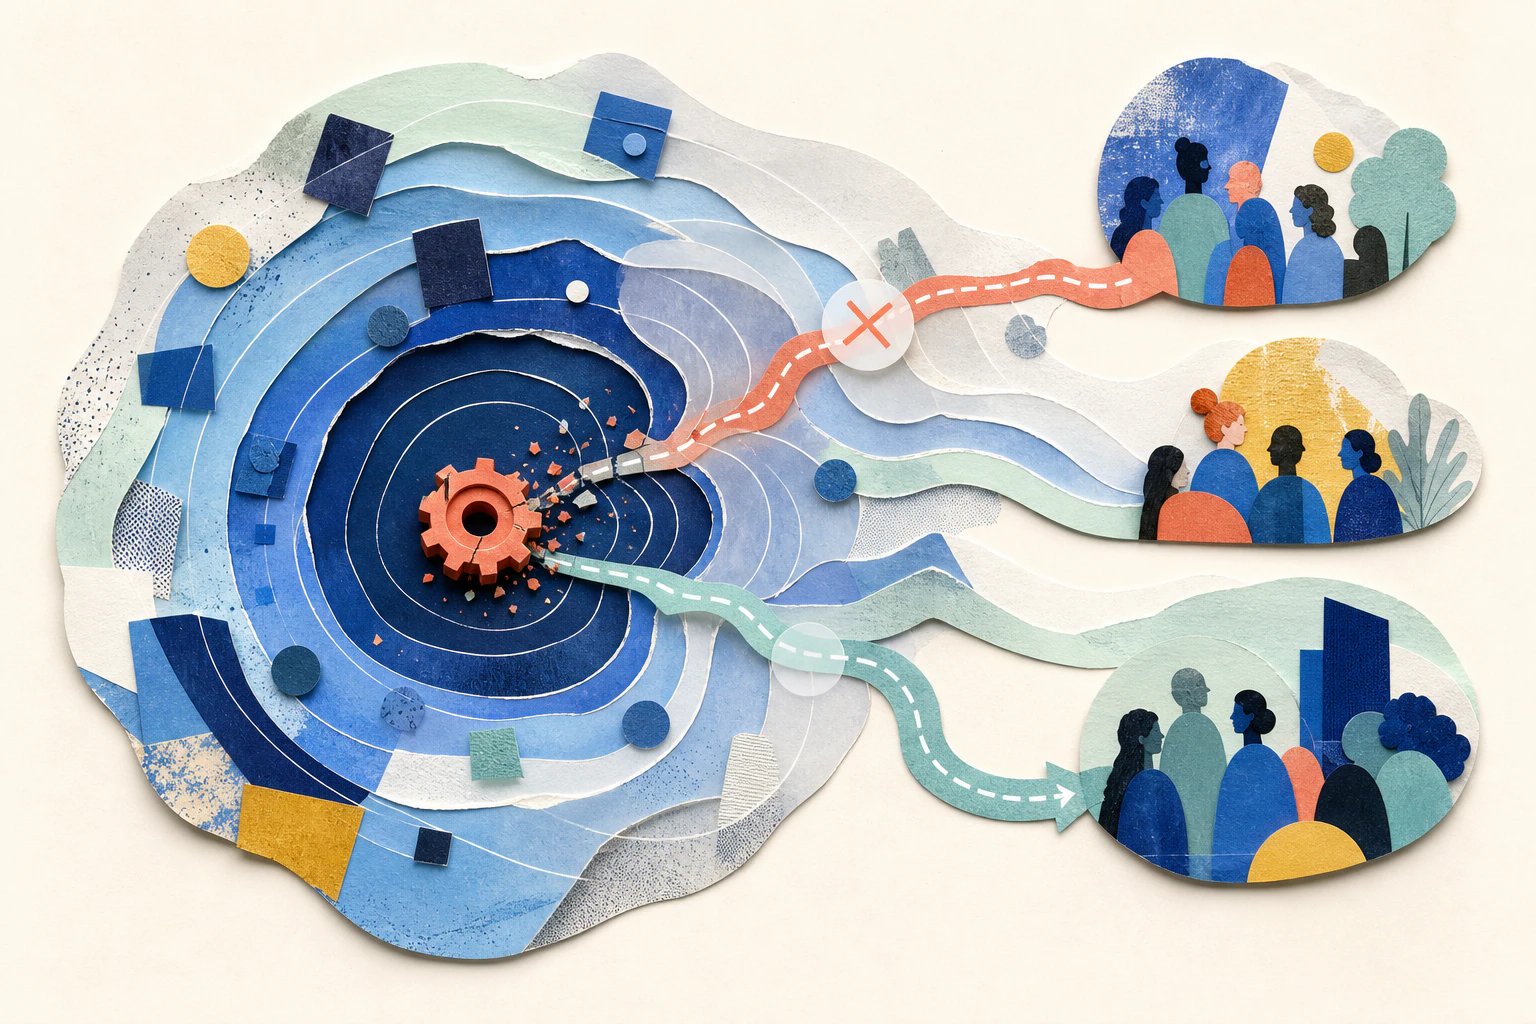
Teams may want to translate impact into revenue. That can support prioritization, but it is easy to overstate.
Revenue exposure is not the same as revenue lost. Failed attempts may be retried; transactions may be delayed rather than abandoned; average order values vary; some affected paths are noncommercial. A precise currency figure can mislead leaders during an incident.
If financial context is used, document:
- Source of transaction data
- Observation window
- Segment assumptions
- Retry and recovery assumptions
- Whether the value is exposure, delay, or confirmed loss
- Confidence range
- Data freshness
Often the safer operational output is a range or transaction count: “order submissions for shard 3 are 40% below the preceding baseline” or “approximately 600 attempts entered retry.” Those figures still require verified telemetry and should not be invented for marketing.
StackScopes should not infer revenue from infrastructure topology alone. The graph can identify affected capabilities and tenant paths; business systems must provide authoritative commercial context.
Hypothetical example: checkout degradation
The following scenario is illustrative, not a customer result.
A SaaS commerce platform runs a checkout API in two Availability Zones. Requests write orders to an Aurora cluster and publish fulfillment events to an SQS queue. Tenants are assigned to database shards. A configuration change removes an inbound security-group rule used by one application task group.
Initial resource view
The database reports healthy. The load balancer reports most targets healthy. One application task group shows connection errors. If responders look only at resource health, the incident appears contained.
Dependency context
The graph shows that the affected task group handles traffic for tenants routed through a particular regional endpoint. It has a WRITES_TO relationship to the cluster, evidenced by configuration and recent traces. The database is healthy, but the path is broken.
The graph also shows:
- Catalog browsing uses a separate read service and remains healthy.
- Cart updates use a cache path and remain available.
- Final order submission depends on the blocked database connection.
- Fulfillment receives events only after a successful database transaction.
- Tenants in another region use a different task group.
Customer-journey view
The “complete a purchase” journey is partially broken. Shoppers can browse and edit carts but cannot submit orders on the affected route. This is more precise than either “checkout is down” or “one security group is unhealthy.”
Tenant view
Routing metadata identifies a bounded tenant segment. The graph uses opaque tenant IDs and reports that tenants on the regional route are potentially affected. Synthetic transactions confirm failures on that path, raising confidence from potential to observed.
Time view
Failed requests enter a limited retry path. The retry budget will exhaust in eight minutes. That gives responders a time-to-impact detail: some requests may still succeed now, but degradation will become more visible soon.
Recovery context
The change timeline shows the security-group update immediately before errors increased. A recovery plan proposes restoring the prior rule, validating connectivity from the affected task group, checking order-write success, and confirming that fulfillment events resume. Human approval is required.
This example demonstrates why customer impact is a chain of evidence. No single resource alarm provides the complete answer.
Implement a practical impact-analysis workflow
1. Define critical journeys
Choose a few important customer outcomes. Name the success condition and owner. Avoid mapping every product feature on day one.
2. Map journeys to workloads
Connect each journey step to the logical service responsible. Record whether it is required, optional, or a fallback.
3. Build the resource dependency graph
Collect provider configuration, infrastructure declarations, and selected runtime telemetry. Preserve relationship semantics, evidence, confidence, and time.
4. Add ownership and criticality
Link workloads and shared dependencies to operating teams. Record criticality dimensions and recovery objectives.
5. Add bounded tenant context
For multi-tenant systems, map shards, routes, or dedicated resources using privacy-conscious identifiers and access controls.
6. Define propagation rules
Specify how each relationship type responds to failure modes. A read replica failure differs from a writer failure; queue delay differs from event loss.
7. Correlate actual signals
Join alerts, metrics, traces, synthetic tests, and change events. Distinguish observed customer degradation from potential exposure.
8. Validate with exercises
Use model-based scenarios and controlled tests. Review surprising paths with service owners. Update evidence rather than merely editing a diagram.
9. Measure model quality
Track coverage, stale relationships, unresolved ownership, rejected inferences, and time to validate impact. Do not use graph size as the primary success metric.
Trade-offs and limitations
Customer-impact modeling demands cross-team data. Product maps, service ownership, tenant placement, and telemetry often live in different systems. Joining them creates governance and privacy responsibilities.
Runtime evidence is incomplete. Sampling can miss rare paths, batch jobs may run outside the observation window, and dormant disaster-recovery dependencies may never appear in traces. Configuration evidence can overstate possible paths. Human validation can become stale. A trustworthy system exposes these limitations.
Impact analysis can also become too complex. A graph with every theoretical IAM and network path may overwhelm responders. Use purpose-specific views, strong filters, and ranked evidence.
Tenant context is sensitive. Collect the minimum needed, use opaque identifiers, enforce access boundaries, audit queries, and define retention. Do not make customer mapping visible to everyone who can inspect infrastructure.
Finally, a digital model does not replace customer-support reports or direct service-level indicators. It should combine infrastructure reasoning with real user signals.
Key takeaways
- Resource health and customer impact are different layers.
- Useful analysis connects state, dependencies, workloads, capabilities, journeys, and tenants.
- Relationship semantics determine how failure can propagate.
- Redundancy and fallbacks must be modeled as evidenced mitigations, not guarantees.
- Time-to-impact can change incident priority.
- Tenant mapping should be temporal, minimal, and access-controlled.
- Communication should separate facts, hypotheses, and unknowns.
- Revenue exposure requires authoritative business data and careful assumptions.
- Model quality depends on coverage, evidence, confidence, and continuous validation.
Frequently asked questions
Can customer impact be calculated from cloud alarms alone?
Usually not. Alarms describe technical conditions. Customer impact also requires workload mapping, dependency semantics, business-capability context, fallbacks, and user signals. Alarms are an input, not the complete answer.
How should teams represent shared infrastructure?
Model the shared resource once, connect each consuming workload with typed relationships, and distinguish operator ownership from consumers. This reveals common failure domains without duplicating the resource.
Should an impact view show exact customer counts?
Only when current, authoritative tenant mapping and the failure scope support that precision. Otherwise show the affected segment, confidence, and unknowns. False precision is harmful during incidents.
What is the difference between potential and confirmed impact?
Potential impact follows a plausible dependency path from a technical condition. Confirmed impact includes direct user, synthetic, transaction, or service-level evidence that the journey is failing or degraded.
How often should mappings be reviewed?
Continuously ingest changing technical evidence, and review critical journey and ownership mappings after material architecture or organizational changes. Periodic resilience reviews can find stale context that automation misses.
Conclusion
Closing the context gap is not about adding customer labels to an alert. It requires a living, temporal model that explains how infrastructure supports workloads and how workloads support customer outcomes.
StackScopes connects topology, dependency evidence, resource state, changes, ownership, and customer-impact context so teams can reason from a failure to its likely consequence. The goal is not to pretend certainty. It is to make facts, assumptions, propagation paths, and unknowns visible enough for engineers to act with confidence.
Official references
- AWS Well-Architected Reliability Pillar
- How AWS Config works
- AWS CloudTrail event history
- Amazon CloudWatch concepts
- Amazon SQS visibility timeout
Related StackScopes reading
Continue exploring
Map the path behind the risk.
Explore cloud topology, failure simulation, blast radius, and evidence-backed recovery with StackScopes.